EES API workflow
eesyapi.RmdThe following article presents an example workflow of how, as an
analyst, someone might connect to the explore education statistics (EES)
API to collect data with the help of eesyapi in R.
As an overview, the stages you will likely need to follow are:
- Find the data set ID
- Query the data set meta data to identify filter and indicator IDs
- Design a query using the relevant IDs
- Post the query to the API
- Perform some post processing of the data
Finding a data set ID
Only some data sets on EES are available via the EES API. This is to maintain minimum standards around the API data catalogue.
Assuming you know the data set within a publication that you would like to query, you will first need to identify the data set ID code. There are two methods to do this, either a) via the data set’s page on the EES website or b) by querying the API itself.
Identifying a data set ID via the API
Finding a data set ID via the API is a two step process. First, you’ll need to find the parent publication ID and second, you’ll need to search the data catalogue within that publication for the data set.
Querying the publication list:
eesyapi::get_publications()This returns a list of all publications by ID and title (along with slug, summary and date last published). From this list, you can find the title of the publication that you’re interested in and pick out the associated publication ID.
For example from the test list, we can pick out “Pupil
attendance in schools”, which has an ID of
9676af6b-d563-41f4-d071-08da8f468680. We can now use
this in the function eesyapi::get_data_catalogue() to find
all the data sets within that publication:
eesyapi::get_data_catalogue("9676af6b-d563-41f4-d071-08da8f468680")This returns a data frame containing data set IDs and titles (along with a summary, the status and information on what’s in the latest version). The data set IDs can be used as shown in the following sections to get a given data set’s summary and meta data, and to query the data set itself.
Finding a data set ID on the EES website
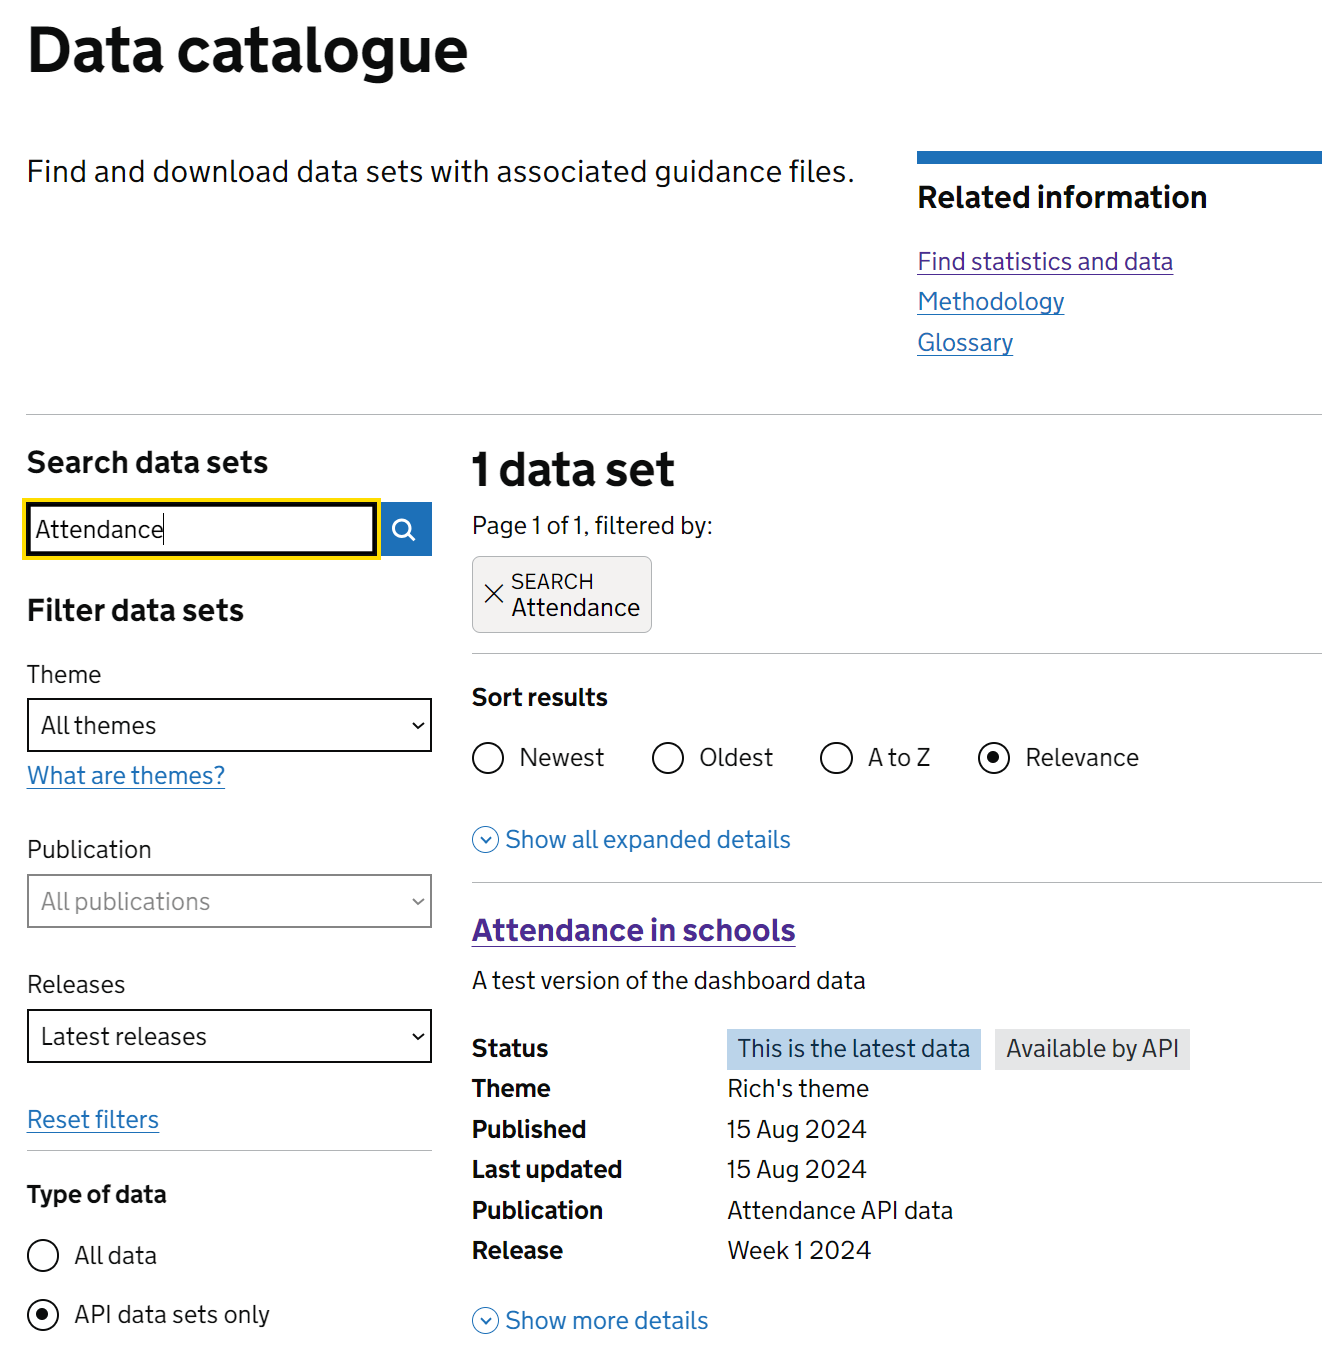
As with any other data set, you can find an API data set in the EES data catalogue. If you know the name, you can filter the catalogue on this as normal. Not all data sets are accessible via the API, so to filter down to just those that are, click the “API data sets only” option as shown in the image below.
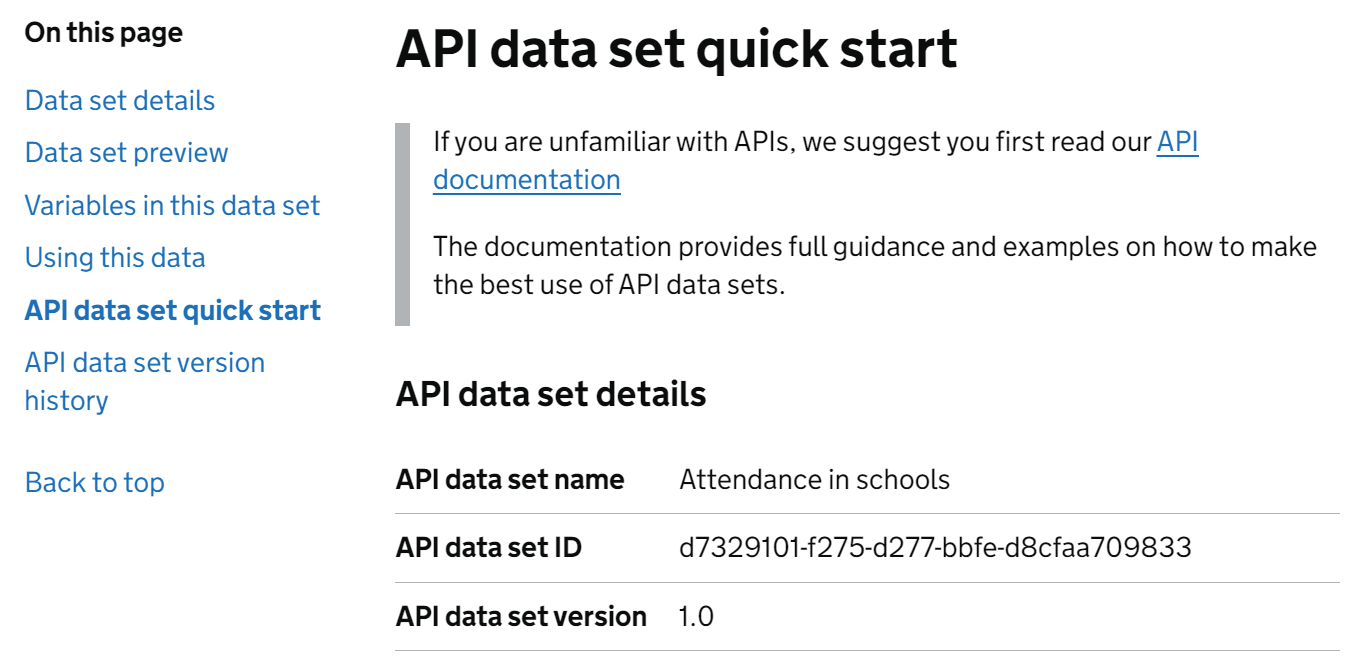
Once you’ve found the data set you need, then click on the title of the data set to be taken to it’s details page in the catalogue. On this page (pictured below), you’ll find the API data set quick start section, which gives the API data set name, API data set ID and API data set version. This API data set ID is what’s needed below to query the data set and its meta data.
Preview underlying data
In the EES API you have the option to preview the underlying data for a given data set. This bypasses the use of IDs, making it a simpler short-term option to explore the available data.
Using eesyapi, you can preview a data set using
preview_dataset() and providing the data set ID as
follows:
eesyapi::preview_dataset("63629501-d3ca-c471-9780-ec4cb6fdf172")This will return a data frame containing the first 10 rows of the data in the form that DfE analysts uploaded it to EES in.
While you can set n_max to Inf, and get the whole data set using
this, you should avoid relying on the preview_dataset()
function in your pipelines or dashboards and instead use it to explore
the data as you create your own custom query using
query_dataset().
If you only read the whole file in using the preview you risk:
- code breaking whenever element labels change
- reading in too much data into active memory, causing R to slow or even crash
Getting the data set meta data
When querying a data set via the API, column names (indicators and filters) and the options available within columns (filter items) are referenced using auto-generated ID codes (known as SQIDs). Therefore, in order to construct a query that involves selecting a subset of filter items or indicators, you’ll need to obtain the IDs associated with those elements.
All those IDs are stored in a data set’s meta data, which can also be
queried via the API. To get those IDs as well as details on what time
periods and geographic levels and locations are available in a given
data set, you can use the function eesyapi::get_meta(),
providing it with your data set’s ID. For example, to get the
“attendance in schools” data from the example attendance API data
publication, you can take the data set ID
63629501-d3ca-c471-9780-ec4cb6fdf172 and provide it as
a parameter to get_meta:
eesyapi::get_meta(dataset_id = "63629501-d3ca-c471-9780-ec4cb6fdf172")This function returns a list of 5 data frames:
-
$time_periods: label, code and period of all available time periods in the data set -
$locations: geographic_level, code, label and item_id of all available locations in the data set -
$filter_columns: col_name and label of all filters in the data set -
$filter_items: col_name, item_label, item_id and default_item for all filter items in the data set -
$indicators: col_name and label of all indicators in the data set
The item_id values provided in $locations and
$filter_items are required to construct queries for
filtering a given data set, whilst time periods can be filtered on the
values in the $time_period code column.
In this example, let’s say we’ve run
eesyapi::get_meta("63629501-d3ca-c471-9780-ec4cb6fdf172")
and we want to filter our data set to obtain data for:
- the “Week 24” time period in “2024”,
- “York” and “England” from the geographies,
- “Absence” from Attendance status
- “Approved educational activity”, “Authorised” and “Unauthorised” from Attendance type
- Just the “All possible sessions” entry for “attendance_reason”
- “Year to date” as the “time_frame”
- And we want to see “Number of sessions” data values.
For this we would need the following codes / item_ids:
- “character(0) character(0)”
- “BT7J3” and “dP0Zw”
- “e4wuS”
- “P9Aeb”, “1Dui3”, “oRfmX”
- “4yTUZ” and “RaVka”
- “X9fKb”
Note that whilst the above IDs are unique within a given item type
(e.g. filter_item), they are not necessarily unique between
types. For example, a given indicator could be assigned the
same ID as a filter_item in a given data set.
As a quick example of how you might quickly query the meta data for these codes, you could try the following example pieces of query code.
Geographies
eesyapi::get_meta(dataset_id = "63629501-d3ca-c471-9780-ec4cb6fdf172") |>
  magrittr::extract2("locations") |>
  dplyr::filter(label %in% c("York", "England"))
#>   item_id   label      code oldCode geographic_level_code geographic_level
#> 1   BT7J3    York E06000014     816                    LA  Local authority
#> 2   dP0Zw England E92000001    <NA>                   NAT         National
Filter columns
Note that the col_id values here correspond to the col_id values in the filter items, which shows which column each item is availble in.
eesyapi::get_meta(dataset_id = "63629501-d3ca-c471-9780-ec4cb6fdf172") |>
  magrittr::extract2("filter_columns")
#>   col_id          col_name             label
#> 1  z4FQE attendance_reason Attendance reason
#> 2  krhsL attendance_status Attendance status
#> 3  uxo41   attendance_type   Attendance type
#> 4  X9fKb   education_phase   Education phase
#> 5  TsPJP        time_frame        Time frame
Filter items
eesyapi::get_meta(dataset_id = "63629501-d3ca-c471-9780-ec4cb6fdf172") |>
  magrittr::extract2("filter_items") |>
  dplyr::filter(
    item_label %in% c(
      "Absence", "Approved educational activity", "Authorised", "Unauthorised"
    )
  )
#>   col_id          col_name             label item_id
#> 1  krhsL attendance_status Attendance status   e4wuS
#> 2  uxo41   attendance_type   Attendance type   P9Aeb
#> 3  uxo41   attendance_type   Attendance type   1Dui3
#> 4  uxo41   attendance_type   Attendance type   oRfmX
#>                      item_label isAggregate
#> 1                       Absence          NA
#> 2 Approved educational activity          NA
#> 3                    Authorised          NA
#> 4 Unauthorised NARetrieving data from a data set
Using query_dataset()
The recommended go-to option for retrieving data is the
query_dataset() function. This provides options for
attaching a pre-made JSON file to a query, attaching a pre-made JSON
string or passing a set of IDs as parameters to create a query for
you.
Querying a data set using parameters
query_dataset() can be given a set of parameters to
build up a query for you. Behind the scenes it creates a JSON string
based on the parameters provided to it by the user. This inherently
limits the extent of the type of queries that you can perform, but it
should cover most basic use cases.
The parameters that you’ll can provide to build up your query are: -
time_periods - locations -
filter_items - indicators (required)
All these are optional, except for indicators which you
must always specify. If you don’t provide any of
time_periods, locations or
filter_items, then you’ll receive all rows from the data
set (although be careful, this may take some time for larger data
sets).
You don’t generally need to use the IDs for filter columns as the query only needs to know the options you want to select from those columns (filter items).
Using the parameters we obtained from get-meta above,
then we can create a query to return session count data for only
Approved educational activity,
Authorised and Unauthorised in the
Absences category, Nationally for
York in Week 4 in
2025, we would supply the following:
eesyapi::query_dataset(
  dataset_id = "63629501-d3ca-c471-9780-ec4cb6fdf172",
  indicators = "X9fKb",
  filter_items = list(
    attendance_status = c("e4wuS"),
    attendance_type = c("P9Aeb", "1Dui3", "oRfmX"),
    time_frame = "5ezdi"
  ),
  geographies = c("NAT|id|dP0Zw", "LA|ID|BT7J3"),
  time_periods = c("2025|W4"),
  page_size = 15,
  page = 1
)
#> Warning: No rows were returned for your query. Set verbose = TRUE to see
#> detailed API response.
#> NULL
Some notes on the above:
-
indicators,time_periods,geographiesandfilter_itemscan all be supplied as vectors -c(...)- and will be interpreted asfilter(... %in% c(...)). -
filter_itemscan be supplied as a list to create more stringent cross-filter combinations, i.e. in the above example rows will only be returned for the specific combinations given across the 4 filters. -
geographiescan be supplied as a data frame to allow for more complex queries such as “give me all LAs in a given region”. The structure for this can be seen by callingexample_geography_query().
Querying a data set using a JSON file or string
If you’re familiar with using JSON and wish to just write your own
query from scratch, then you can use query_dataset() with
the json_query parameter as follows:
json_query <- "{
  \"criteria\": {
    \"and\": [
      {
        \"filters\": {
          \"eq\": \"3xu8u\"
        }
      },
      {
        \"locations\": {
          \"eq\": {
            \"level\": \"LA\",
            \"id\": \"BT7J3\"
          }
        }
      }
    ]
  },
  \"indicators\": [
    \"X9fKb\"
  ],
  \"debug\": false,
  \"page\": 1,
  \"pageSize\": 10
}"
eesyapi::query_dataset(
  dataset_id = "63629501-d3ca-c471-9780-ec4cb6fdf172",
  json_query = json_query
)
#>    time_period time_identifier geographic_level la_name   la_code la_oldCode
#> 1         2026         Week 21  Local authority    York E06000014        816
#> 2         2026         Week 21  Local authority    York E06000014        816
#> 3         2026         Week 21  Local authority    York E06000014        816
#> 4         2026         Week 21  Local authority    York E06000014        816
#> 5         2026         Week 21  Local authority    York E06000014        816
#> 6         2026         Week 21  Local authority    York E06000014        816
#> 7         2026         Week 21  Local authority    York E06000014        816
#> 8         2026         Week 21  Local authority    York E06000014        816
#> 9         2026         Week 21  Local authority    York E06000014        816
#> 10        2026         Week 21  Local authority    York E06000014        816
#>    nat_name  nat_code                 reg_name  reg_code
#> 1   England E92000001 Yorkshire and The Humber E12000003
#> 2   England E92000001 Yorkshire and The Humber E12000003
#> 3   England E92000001 Yorkshire and The Humber E12000003
#> 4   England E92000001 Yorkshire and The Humber E12000003
#> 5   England E92000001 Yorkshire and The Humber E12000003
#> 6   England E92000001 Yorkshire and The Humber E12000003
#> 7   England E92000001 Yorkshire and The Humber E12000003
#> 8   England E92000001 Yorkshire and The Humber E12000003
#> 9   England E92000001 Yorkshire and The Humber E12000003
#> 10  England E92000001 Yorkshire and The Humber E12000003
#>                    attendance_reason attendance_status
#> 1  All approved educational activity        Attendance
#> 2  All approved educational activity        Attendance
#> 3  All approved educational activity        Attendance
#> 4  All approved educational activity        Attendance
#> 5  All approved educational activity        Attendance
#> 6  All approved educational activity        Attendance
#> 7  All approved educational activity        Attendance
#> 8  All approved educational activity        Attendance
#> 9  All approved educational activity        Attendance
#> 10 All approved educational activity        Attendance
#>                  attendance_type education_phase   time_frame session_count
#> 1  Approved educational activity     All schools       Monday           330
#> 2  Approved educational activity     All schools      Tuesday           563
#> 3  Approved educational activity     All schools    Wednesday           925
#> 4  Approved educational activity     All schools     Thursday           438
#> 5  Approved educational activity     All schools       Friday           524
#> 6  Approved educational activity     All schools         Week          2780
#> 7  Approved educational activity     All schools Year to date         67780
#> 8  Approved educational activity         Primary       Monday           224
#> 9  Approved educational activity         Primary      Tuesday           473
#> 10 Approved educational activity         Primary    Wednesday           803
FAQs
Why do you use IDs rather than the actual labels used in the data?
The IDs are intended to aid in future proofing for users that may develop automated pipelines that connect to the EES API. Labeling inevitably changes, for example if a “Total” entry is renamed to “All pupils” or “All schools” to add clarity. If the underlying content of that item stays the same, then automated pipelines will be required to still connect to the same item, therefore each item has an associated ID that will remain unchanged in a given data set as it is updated with new data over the subsequent releases, even if a renaming of a field occurs.